Hey everyone! If you’re running a homelab like me, you know that sinking feeling when you discover one of your services has been down for hours (or days) without you realizing it. Maybe your Plex server crashed during a family movie night, or your Pi-hole stopped blocking ads across your network. Whatever the case, having a reliable monitoring solution is absolutely essential for any serious homelab enthusiast.
Enter Uptime Kuma – a fancy, open-source, self-hosted monitoring tool that’s become a favorite in the homelab community. It’s lightweight, beautiful, and ridiculously easy to set up. In this guide, I’ll walk you through everything you need to know to get Uptime Kuma running and keeping watch over your precious infrastructure.
What Is Uptime Kuma?
Uptime Kuma is a self-hosted uptime monitoring tool created by Louis Lam. Think of it as your own personal version of services like UptimeRobot or Pingdom, but running entirely on your own hardware. The best part? It’s completely free and open-source.
The interface is sleek, modern, and reactive – honestly, it’s one of the best-looking self-hosted applications I’ve come across. It features dark mode support (essential for us night-owl tinkerers), beautiful ping charts, and a dashboard that gives you an instant overview of your entire infrastructure’s health.
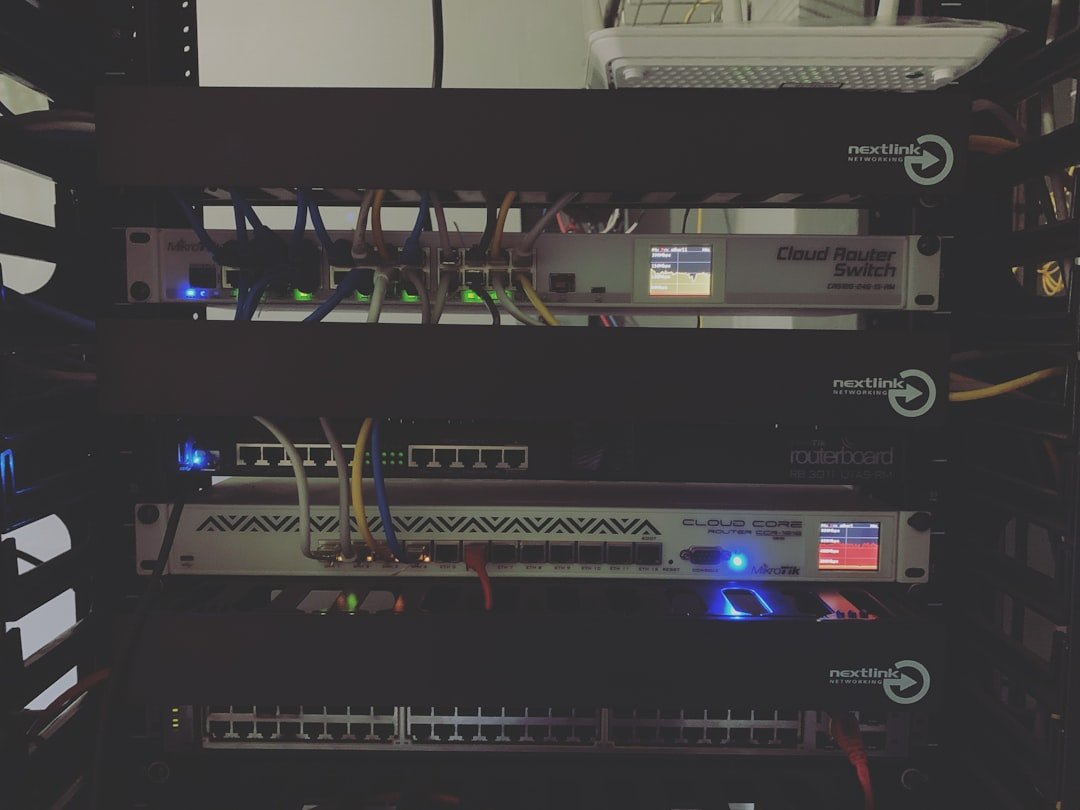
Why You Need Monitoring in Your Homelab
Before we dive into the setup, let’s talk about why monitoring matters. Your homelab probably runs a variety of services:
- Media servers (Plex, Jellyfin, Emby)
- Network services (Pi-hole, AdGuard Home, DNS servers)
- Home automation (Home Assistant, Node-RED)
- File storage (Nextcloud, Syncthing)
- Game servers for you and your friends
- Development environments and databases
When any of these go down, you want to know about it immediately – not when your family complains they can’t watch their shows or when you try to access something and it’s broken. Uptime Kuma monitors your services at configurable intervals (as low as 20 seconds) and alerts you the moment something goes wrong.
Key Features That Make Uptime Kuma Shine
Here’s what makes Uptime Kuma particularly well-suited for homelab monitoring:
Comprehensive Monitoring Types
Uptime Kuma supports a wide variety of monitoring methods:
- HTTP(S) Monitors – Check if your web applications and services are responding
- TCP Monitors – Verify specific ports are open (great for game servers, email, etc.)
- Ping Monitors – Simple ICMP pings for network devices like routers and switches
- DNS Record Monitors – Ensure your DNS is resolving correctly
- Docker Container Monitors – Check if your containers are running
- Database Monitors – Support for MySQL, MariaDB, PostgreSQL, MongoDB, and MS SQL Server
- Keyword Monitoring – Verify specific text appears on a webpage
- JSON Query Monitoring – Parse JSON responses for specific values
- WebSocket Monitors – Check WebSocket connections
- Push Monitors – For services that can send heartbeats to Uptime Kuma
- Steam Game Server Monitors – Perfect for those hosting game servers
Extensive Notification Options
What good is monitoring if you can’t get notified? Uptime Kuma supports over 90 notification services, including:
- Telegram
- Discord
- Slack
- Email (SMTP)
- Pushover
- Gotify
- Apprise (which connects to 50+ additional services)
- And many, many more
Public Status Pages
Want to share your infrastructure status with family members or users? Uptime Kuma lets you create beautiful public status pages. You can organize monitors into groups, post incidents and maintenance notices, and even use custom domain names for different status pages.
Installation Methods
There are several ways to get Uptime Kuma running. Let’s cover the most popular options.
Docker Installation (Recommended)
Docker is by far the easiest and most popular way to deploy Uptime Kuma. A single command gets you up and running:
docker run -d --restart=always -p 3001:3001 -v uptime-kuma:/app/data --name uptime-kuma louislam/uptime-kuma:1
Let’s break down what this command does:
- -d – Runs the container in detached mode (background)
- –restart=always – Automatically restarts the container if it crashes or after a reboot
- -p 3001:3001 – Maps port 3001 on your host to the container
- -v uptime-kuma:/app/data – Creates a persistent volume for your data
- –name uptime-kuma – Gives the container a friendly name
Docker Compose Installation
If you prefer Docker Compose (and you should for easier management), create a docker-compose.yml file:
version: '3'

services:

  uptime-kuma:

    image: louislam/uptime-kuma:1

    container_name: uptime-kuma

    volumes:

      - ./data:/app/data

    ports:

      - 3001:3001

    restart: always
Then simply run docker-compose up -d to start the service.
Raspberry Pi Installation
Uptime Kuma is lightweight enough to run on a Raspberry Pi, which is actually an excellent choice. Since Uptime Kuma barely consumes any resources even with tons of services and alerts in place, a Raspberry Pi 3 or newer works perfectly. The Docker installation method works the same on Pi – just make sure you have Docker installed first.
Running Uptime Kuma on a separate device like a Pi has a significant advantage: if your main server goes down, your monitoring system stays up and can still alert you.
Non-Docker Installation
If you prefer running without Docker, you can install from source:
git clone https://github.com/louislam/uptime-kuma.git

cd uptime-kuma

npm run setup

node server/server.js
For production use, you’ll want to use PM2 to keep it running in the background.
Initial Setup and Configuration
Once Uptime Kuma is running, access it by navigating to http://your-server-ip:3001 in your browser. You’ll be greeted with a setup wizard:
- Choose your language
- Create an admin username and password
- Click Create to access your dashboard
That’s it – you’re ready to start adding monitors!
Adding Your First Monitor
Click the “Add New Monitor” button to create your first monitoring target. Here’s how to set up common monitor types:
HTTP(S) Monitor
Perfect for web services and APIs:
- Select “HTTP(s)” as the monitor type
- Give it a friendly name (e.g., “Nextcloud”)
- Enter the URL
- Set your heartbeat interval (how often to check)
- Configure retries and timeout settings
- Click Save
Docker Container Monitor
To monitor Docker containers directly, you’ll need to bind the Docker socket. Update your Docker run command or compose file to include:
-v /var/run/docker.sock:/var/run/docker.sock
Then you can add monitors that check if specific containers are running.
Ping Monitor
Great for network infrastructure:
- Select “Ping” as the monitor type
- Enter the hostname or IP address
- Set your check interval
Setting Up Notifications
Monitoring is only useful if you get alerted when things go wrong. Here’s how to set up some popular notification services:
Discord Notifications
- In Discord, go to Server Settings → Integrations → Webhooks
- Create a new webhook and copy the URL
- In Uptime Kuma, go to Settings → Notifications → Setup Notification
- Select Discord, paste your webhook URL, and save
Telegram Notifications
- Open Telegram and search for @BotFather
- Send /newbot and follow the prompts to create a bot
- Copy the API token provided
- Get your Chat ID (you can use @userinfobot to find it)
- In Uptime Kuma, add a Telegram notification with your bot token and chat ID
Telegram is often recommended for beginners as it’s considered the easiest to set up.
Creating Status Pages
Status pages are a great way to share your infrastructure health with others. To create one:
- Click “Status Pages” in the navigation
- Click “+ New Status Page”
- Choose a name and slug (this becomes the URL)
- Add your monitors to groups
- Customize the appearance
- Optionally add a custom domain
You can create groups to organize your monitors logically (e.g., “Network Infrastructure,” “Media Services,” “Home Automation”) and post incidents or scheduled maintenance notices.
Pro Tips for Homelab Monitoring
Consider External Monitoring
Here’s a critical consideration: if you run Uptime Kuma on your primary homelab server and that server goes down, you won’t get any alerts because the monitoring itself is offline!
The solution is to host part of your monitoring externally. A cheap VPS costing just a few dollars a month can serve as a watchdog, constantly checking whether your homelab and internet connection are reachable. If everything goes offline at home, you’ll still receive notifications because the VPS-based Uptime Kuma instance remains operational.
Monitor What Matters
Don’t go overboard monitoring every single thing. Focus on:
- Critical services that family members depend on
- Network infrastructure (routers, switches, access points)
- Services exposed to the internet
- Databases and storage systems
Set Appropriate Intervals
While Uptime Kuma can check as frequently as every 20 seconds, consider whether that’s necessary. For most homelab services, checking every 60-120 seconds is sufficient and reduces load on both your monitoring server and monitored services.
Use Groups Wisely
Organize your monitors into logical groups. This makes your dashboard easier to read and your status pages more useful for others.
Maintenance Considerations
Self-hosting Uptime Kuma does bring some maintenance burden. You’ll need to:
- Keep the application updated (check GitHub releases)
- Maintain your server or Pi
- Ensure security patches are applied
- Back up your configuration (the /app/data volume)
That said, Uptime Kuma is remarkably stable and low-maintenance compared to more complex monitoring solutions like Zabbix, Grafana, or Prometheus. It’s perfect for those who want powerful monitoring without spending hours configuring things.
Wrapping Up
Uptime Kuma has become an essential tool in my homelab, and I suspect it will become one in yours too. It strikes the perfect balance between powerful features and ease of use. Within minutes of installation, you can have comprehensive monitoring of your entire infrastructure with instant notifications when things go wrong.
Whether you’re running a simple media server setup or a complex multi-service homelab, Uptime Kuma scales to meet your needs. Give it a try – your future self will thank you the first time you catch an outage before anyone else notices.
Happy monitoring!
Leave a Reply